Infrastructure WA

2022 State Infrastructure Strategy: Foundations for a Stronger Tomorrow

Western Australia’s (WA) first State Infrastructure Strategy (Strategy) lays the foundations for infrastructure planning, delivery and management for the next 2 decades. It represents a significant step forward in the way government plans, delivers and manages infrastructure across the state.

Foundations for a Stronger Tomorrow outlines the state's significant infrastructure needs and priorities. It provides a long-term vision and infrastructure outlook underpinned by 6 strategic opportunities and 10 strategy objectives and is divided into broad infrastructure types categorised as 7 cross-cutting themes and 9 infrastructure sectors. It reaches across WA’s 10 regions, to identify both build and non-build solutions such as policy reforms and priority projects and programs.


Throughout the development of the Strategy and its extensive consultation process, a number of core themes were identified that underpin Infrastructure WA's (IWA) recommendations. These core themes include:


  • Managing demand for infrastructure through prevention, early intervention and pricing
  • Improving the quality and consistency of strategic infrastructure planning and processes
  • Addressing climate change
  • Implementing data sharing and other tools to support infrastructure planning and investment decision making 
  • Optimising the existing infrastructure asset base
  • Identifying major infrastructure project and programs.


Each cross-cutting theme and sector takes into account both build and non-build infrastructure considerations. Non-build solutions include areas such as policy, regulation, pricing, asset management, technology, procurement and governance reforms, along with new infrastructure projects and programs.


As part of developing the Strategy and its recommendations, IWA considered a number of key elements such as: 


  • the identification of strategic opportunities for the state which helped form the 2042 vision and infrastructure outlook
  • Strategy objectives which indicated areas IWA believed to be critically important to ensure the 2042 vision met
  • identification and application of 7 cross-cutting themes and 9 sectors, with key consideration of other drivers such as resilience and demand management.

Cross-Cutting Themes

The Strategy includes 7 cross-cutting themes that emerged through considering the impact of external drivers as well as each sector's relationship to others. 


The cross-cutting themes influence WA's infrastructure agenda, underpin the Strategy and address matters that apply to multiple infrastructure sector across the infrastructure lifecycle. 


Looking at the relationships across multiple sectors has the potential to streamline processes, make better use of resources and identify where opportunities can result in benefits to a ranfe of stakeholders. 


There are also opportunities to improve alignment across sectoral-based infrastructure plans, and better consider any independencies and associated opportunities for efficiencies across sectors. For example, asset management applies to all infrastructure sectors and seeks consistent practices and expectations for agencies to embed in their approaches and processes across the infrastructure lifecycle. 


Sectors

To enable a system-wide view, the Strategy addresses a broad range of infrastructure types, categorised as 9 sectors. 


This categorisation allows for the identification of themes and interdependencies common within similar infrastructure types. The primary focus of WA’s first State Infrastructure Strategy has been on infrastructure owned and delivered by state government agencies and government trading enterprises, and infrastructure that has a direct or indirect financial or policy implication for state government.


Enabling infrastructure such as energy, water and transport underpin society and are critical to maintaining the economy and our standard of living. Social infrastructure such as health, education, justice, emergency services, and the arts enable services that support the wellbeing of our community.


The sectors also consider resilience, the Strategy’s vision, strategic opportunity areas, its overarching objectives and core themes which underpin most of IWA’s recommendations.


Regions

Browse by Region

Kimberley Kimberley Region Kununurra Poi Kununurra Broome Poi Broome Derby Poi Derby Fitzroy Crossing Poi FitzroyCrossing Halls Creek Poi HallsCreek Pilbara Pilbara Region Karratha Poi Karratha Port Hedland Poi Port Hedland Onslow Poi Onslow Newman Poi Newman Tom Price Poi Tom Price Gascoyne Gascoyne Region Canarvon Poi Canarvon Exmouth Poi Exmouth Mid West Mid West Region Geraldton Poi Geraldton Morawa Poi Morawa Goldfields Esperance Region Kalgoorlie-Boulder Poi Kalgoorlie-Boulder Esperance Poi Esperance Wheatbelt Wheatbelt Region Jurien Bay Poi Jurien Bay Northam Poi Northam Perth Perth Region Perth Poi Perth Peel Peel Region Boddington Poi Boddington Mandurah Poi Mandurah South West South West Region Bunbury Poi Bunbury Busselton Poi Busselton Margaret River Poi MargaretRiver Manjimup Poi Manjimup Collie Poi Collie Great Southern Great Southern Region Albany Poi Albany Katanning Poi Katanning Denmark Poi Denmark Labels Kimberley Label Kimberley Pilbara Label Pilbara Gascoyne Label Gascoyne Mid West Label Mid West Goldfields-Esperance Label Goldfields-Esperance Wheatbelt Label Wheatbelt Perth Label Zoomed In Perth Perth Label Zoomed Out Perth Peel Label Zoomed In Peel Peel Label Zoomed Out Peel South West Label Zoomed In South West South West Label Zoomed Out South West Great Southern Label Zoomed In Great Southern Great Southern Label Zoomed Out Great Southern

All regions

WA's regions

Region Image

The long-term success of WA relies on generating strong and inclusive growth across the state’s 10 regions.


WA’s regions are highly diverse, with a range of social, environmental and economic strengths, and inequalities such as life expectancy, unemployment and digital accessibility. The regions are highly interdependent, with social and economic linkages spanning regional boundaries and global markets.


The 2022 Strategy takes a place-based approach in order to tailor infrastructure responses to the needs and opportunities of the Perth metropolitan area and the state’s 9 regional areas.


The 2022 Strategy examines where regional strengths and strategic opportunities intersect in order to identify infrastructure directions to realise their unique potential. Information on the key strengths and infrastructure directions for the state’s 9 regional areas is provided on each individual region page. 


To realise the 2022 Strategy’s vision the regions must also leverage their collective strengths. Considerable flow-on opportunity will come from a stronger, more collaborative approach to regional development. 


The 2022 Strategy makes recommendations that address several cross-regional challenges and opportunities:  


  • Improving Aboriginal outcomes 
  • Mitigating and adapting to climate change 
  • Securing reliable and affordable energy 
  • Improving water security 
  • Improving waste management and resource recovery 
  • Strengthening regional transport and supply chain connectivity 
  • Improving regional planning and coordination 
  • Addressing gaps in social infrastructure (housing, health, education and training, arts, cultural sport and recreation, justice and public safety).


While each of WA’s regions are distinct, consultation highlighted that many face shared challenges and opportunities that need to be addressed to achieve the 2022 Strategy’s vision. As such, the majority of the 2022 Strategy’s 93 recommendations apply to multiple regions. It is expected that the unique circumstances of each region are taken into account when implementing recommendations.


Note: Settlement hierarchy as identified in the State planning strategy 2050

* Western Australian Planning Commission (WAPC), State planning strategy 2050, WAPC, 2014, accessed 7 December 2021.

Wheatbelt region

Region Image

The Wheatbelt is primarily an agricultural region, dominated by the grains and livestock industries. The Wheatbelt consists of 42 local government areas, with the Shire of Northam having the largest resident base.

Key statistics*

Estimated resident population: 73,690

Gross regional product: $7.4 billion

Key strengths

  • Agriculture and food
  • Integrated road and rail freight network
  • Proximity to Perth

Infrastructure directions

  • Support agriculture and food, value-adding and supply chain efficiency
  • Plan and adapt service delivery and infrastructure to accommodate population change and structural readjustment

While the Wheatbelt region is distinct, consultation highlighted that many regions face shared challenges and opportunities that need to be addressed to achieve the 2022 Strategy’s vision. As such, the majority of the 2022 Strategy’s 93 recommendations apply to the Wheatbelt and other regions. It is expected that the unique circumstances of each region are taken into account when implementing recommendations.

* Adapted from Australian Bureau of Statistics, Regional population: 2019–20 financial year; Department of Jobs, Tourism, Science and Innovation, Western Australia economic profile – May 2021.

South West region

Region Image

The South West region is known for its ideal climate, pristine coastline, wineries, tall forests, rolling farmland and relaxed lifestyle. With a geographic area of over 23,000 square kilometres, the South West consists of 12 local government areas and has a major regional centre in Bunbury and a key regional centre in Busselton.

Key statistics*

Estimated resident population: 181,801

Gross regional product: $14.9 billion

Key strengths

  • Agriculture and food
  • Integrated road and rail freight network
  • Proximity to Perth

Infrastructure directions

  • Support interstate and international tourism, and the South West as a world class tourism precinct
  • Support agriculture and food, value adding, and innovation and advanced manufacturing
  • Support population growth, Greater Bunbury as a major population centre, and Bunbury Faster Rail investigations and planning

While the South West region is distinct, consultation highlighted that many regions face shared challenges and opportunities that need to be addressed to achieve the 2022 Strategy’s vision. As such, the majority of the 2022 Strategy’s 93 recommendations apply to the South West and other regions. It is expected that the unique circumstances of each region are taken into account when implementing recommendations.

* Adapted from Australian Bureau of Statistics, Regional population: 2019–20 financial year; Department of Jobs, Tourism, Science and Innovation, Western Australia economic profile – May 2021.

Perth region

Region Image

Perth, as WA’s capital city, is known for its diverse natural and built attractions, sunny climate, consistently high liveability ratings and strong business community. With a geographic area of over 6,000 square kilometres, the Perth metropolitan area consists of 30 local government areas and is categorised by Infrastructure Australia as a ‘fast-growing city’.

Key statistics*

Estimated resident population: 1,985,640

Gross regional product $186.1 billion

Key strengths

  • Main population, economic and transport hub
  • Leading minerals and energy city
  • One of the most liveable cities in the world

Infrastructure directions

  • Central Perth must remain a focus for infrastructure investment
  • Unlock barriers through an urban consolidation action program.
  • Influence the dynamics of Perth’s CBD and immediate surrounds

While the Perth metropolitan region is distinct, consultation highlighted that many regions face shared challenges and opportunities that need to be addressed to achieve the 2022 Strategy’s vision. As such, many of the 2022 Strategy’s 93 recommendations apply to Perth and other regions. It is expected that the unique circumstances of each region are taken into account when implementing recommendations.

* Adapted from Australian Bureau of Statistics, Regional population: 2019–20 financial year; Department of Jobs, Tourism, Science and Innovation, Western Australia economic profile – May 2021.

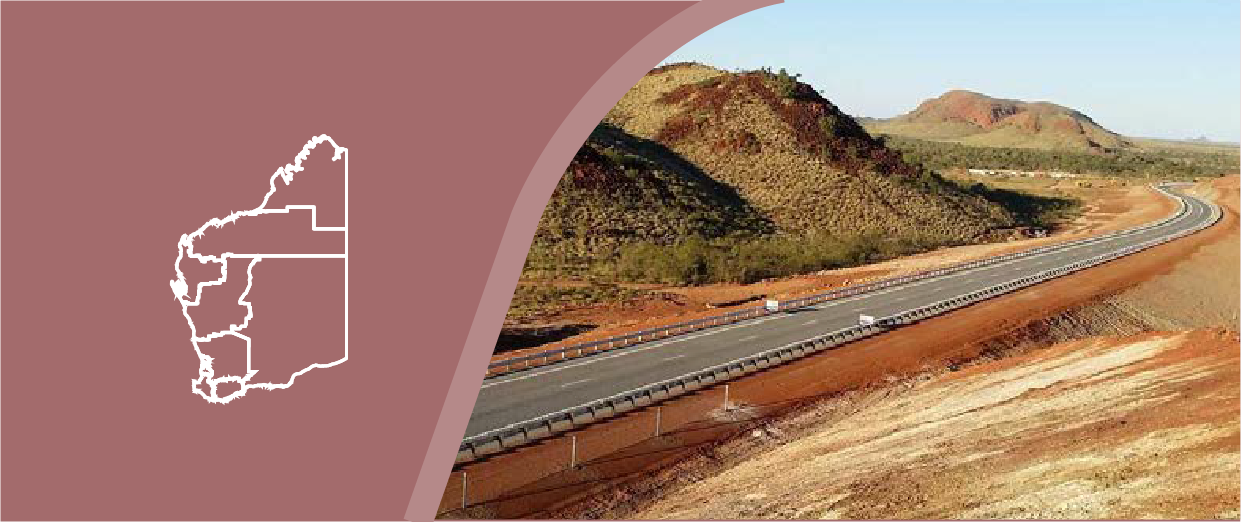
Pilbara region

Region Image

The Pilbara region is known for its ancient landscapes, rich onshore and offshore resource deposits and one of the world’s largest collections of Aboriginal engraved rock art. With a geographic area of over 500,000 square kilometres, the Pilbara consists of 4 local government areas, and has key regional centres in Karratha and Port Hedland.

Key statistics*

Estimated resident population: 62,841

Gross regional product: $57.3 billion

Key strengths

  • Globally significant resources sector and largest regional economy
  • Solar resource
  • Significant Aboriginal population, culture and heritage

Infrastructure directions

  • Support resources value-adding, productivity and innovation
  • Support renewable energy and hydrogen industry
  • Support and advance Aboriginal enterprise and improve the liveability of remote Aboriginal communities and town-based reserves

While the Pilbara region is distinct, consultation highlighted that many regions face shared challenges and opportunities that need to be addressed to achieve the 2022 Strategy’s vision. As such, the majority of the 2022 Strategy’s 93 recommendations apply to the Pilbara and other regions. It is expected that the unique circumstances of each region are taken into account when implementing recommendations.

* Adapted from Australian Bureau of Statistics, Regional population: 2019–20 financial year; Department of Jobs, Tourism, Science and Innovation, Western Australia economic profile – May 2021.

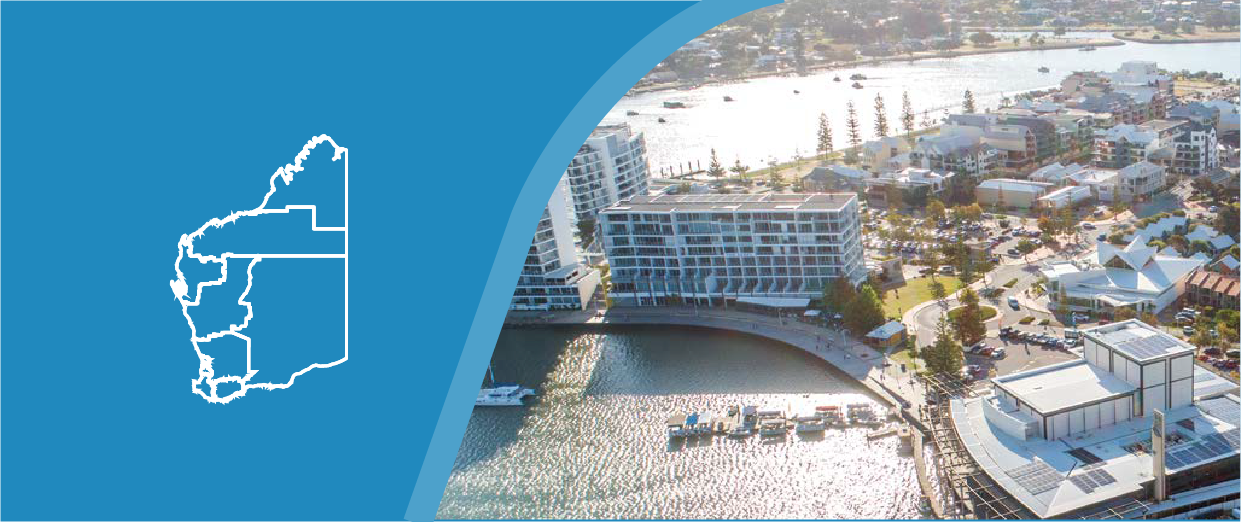
Peel region

Region Image

Peel is a highly attractive region in which to live, characterised by coastal, farming and native forest areas, estuaries, dams and escarpments. In close proximity to Perth and with a geographic area of over 6,000 square kilometres, Peel consists of 5 local government areas and has a major regional centre in Mandurah.

Key statistics*

Estimated resident population: 146,239

Gross regional product: $10.3 billion

Key strengths

  • Resources and value-adding, and agriculture and food
  • Liveability and proximity to Perth – fastest growing regional population and largest regional centre (Mandurah)
  • Road, rail and port access, and available commercial and industrial land

Infrastructure directions

  • Support resources value-adding, and agriculture and food
  • Support innovation and advanced manufacturing
  • Support population growth and address gaps in social services and infrastructure, including health, education, training and housing

While the Peel region is distinct, consultation highlighted that many regions face shared challenges and opportunities that need to be addressed to achieve the 2022 Strategy’s vision. As such, the majority of the 2022 Strategy’s 93 recommendations apply to the Peel and other regions. It is expected that the unique circumstances of each region are taken into account when implementing recommendations.

* Adapted from Australian Bureau of Statistics, Regional population: 2019–20 financial year; Department of Jobs, Tourism, Science and Innovation, Western Australia economic profile – May 2021.

Mid West region

Region Image

The Mid West region offers long stretches of coastline with limestone cliffs, sand plains, wildflowers and the world’s oldest rock formations. With a geographic area of over 285,000 square kilometres the Mid West consists of 16 local government areas and has a key regional centre in Geraldton.

Key statistics*

Estimated resident population: 52,769

Gross regional product: $9.5 billion

Key strengths

  • Agriculture and food, and resources
  • Solar and wind resources
  • Globally significant space science infrastructure – Murchison Radio-astronomy Observatory and radio quiet zone to support Square Kilometre Array

Infrastructure directions

  • Support agriculture and food
  • Support renewable energy and hydrogen industry
  • Support and capitalise on space science infrastructure

While the Mid West region is distinct, consultation highlighted that many regions face shared challenges and opportunities that need to be addressed to achieve the 2022 Strategy’s vision. As such, the majority of the 2022 Strategy’s 93 recommendations apply to the Mid West and other regions. It is expected that the unique circumstances of each region are taken into account when implementing recommendations.

* Adapted from Australian Bureau of Statistics, Regional population: 2019–20 financial year; Department of Jobs, Tourism, Science and Innovation, Western Australia economic profile – May 2021.

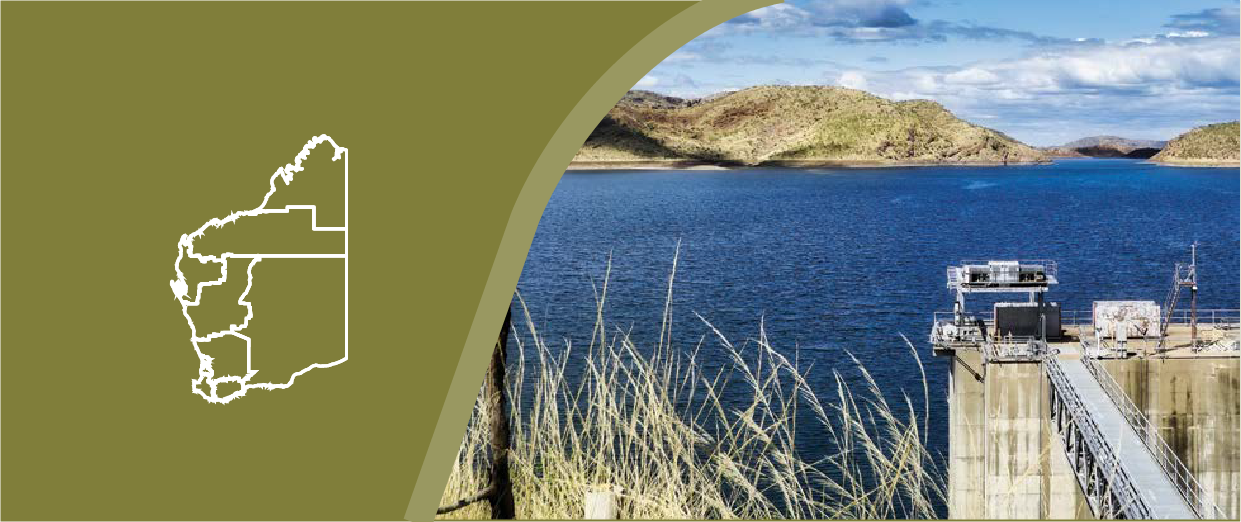
Kimberley region

Region Image

The Kimberley is a vast and remote region in the north of Western Australia known for its rugged natural-beauty, unique biodiversity and rich Aboriginal culture. With a geographic area of over 420,000 square kilometres, the Kimberley consists of 4 local government areas and has key regional centres in Broome and Kununurra.

Key statistics*

Estimated resident population: 36,054

Gross regional product: $3.2 billion

Key strengths

  • Tourism, agriculture and food, and resources
  • Significant Aboriginal population, culture and heritage
  • Natural environment (including a World Heritage area)

Infrastructure directions

  • Support interstate and international tourism, and the Kimberley (including Broome) as a world-class tourism precinct
  • Support agriculture and food, including realising the potential of the Ord River Irrigation Area
  • Support and advance Aboriginal enterprise, and improve the liveability of remote Aboriginal communities and town-based reserves

While the Kimberley region is distinct, consultation highlighted that many regions face shared challenges and opportunities that need to be addressed to achieve this 2022 Strategy’s vision. As such, the majority of the 2022 Strategy’s 93 recommendations apply to the Kimberley and other regions. It is expected that the unique circumstances of each region are taken into account when implementing recommendations.

* Adapted from Australian Bureau of Statistics, Regional population: 2019–20 financial year; Department of Jobs, Tourism, Science and Innovation, Western Australia economic profile – May 2021.

Great Southern region

Region Image

The Great Southern region offers a unique combination of rugged coastlines, pristine beaches and ancient forests and is recognised as a major residential and tourist destination. With a geographical area of over 39,000 square kilometres, the Great Southern consists of 11 local government areas and has a key regional centre in Albany.

Key statistics*

Estimated resident population: 61,351

Gross regional product: $4.1 billion

Key strengths

  • Agriculture and food
  • Liveability
  • Road, rail and port access

Infrastructure directions

  • Support agriculture and food, value-adding and supply chain efficiency
  • Address gaps in social services and infrastructure, including health, education, training and housing
  • Support increased water and wastewater network capacity to improve water security

While the Great Southern region is distinct, consultation highlighted that many regions face shared challenges and opportunities that need to be addressed to achieve the 2022 Strategy’s vision. As such, the majority of the 2022 Strategy’s 93 recommendations apply to the Great Southern and other regions. It is expected that the unique circumstances of each region are taken into account when implementing recommendations.

* Adapted from Australian Bureau of Statistics, Regional population: 2019–20 financial year; Department of Jobs, Tourism, Science and Innovation, Western Australia economic profile – May 2021.

Goldfields–Esperance region

Region Image

The Goldfields area is best known for its rich history in gold mining and the Esperance area for its agriculture sector and world-class coastal attractions. With a geographic area of over 950,000 square kilometres – the largest region in Western Australia – the Goldfields-Esperance region consists of 10 local government areas and has major regional centres in Kalgoorlie and Esperance.

Key statistics*

Estimated resident population: 53,914

Gross regional product: $21.9 billion

Key strengths

  • Resources, and agriculture and food
  • Road, rail and port access
  • Significant Aboriginal population, culture and heritage

Infrastructure directions

  • Support resources value-adding and supply-chain efficiency
  • Plan and adapt service delivery and infrastructure to accommodate population change and structural readjustment
  • Support and advance Aboriginal enterprise and improve the liveability of remote Aboriginal communities and town-based reserves

While Goldfields-Esperance region is distinct, consultation highlighted that many regions face shared challenges and opportunities that need to be addressed to achieve the 2022 Strategy’s vision. As such, the majority of the 2022 Strategy’s 93 recommendations apply to Goldfields-Esperance and other regions. It is expected that the unique circumstances of each region are taken into account when implementing recommendations.

* Adapted from Australian Bureau of Statistics, Regional population: 2019–20 financial year; Department of Jobs, Tourism, Science and Innovation, Western Australia economic profile – May 2021.

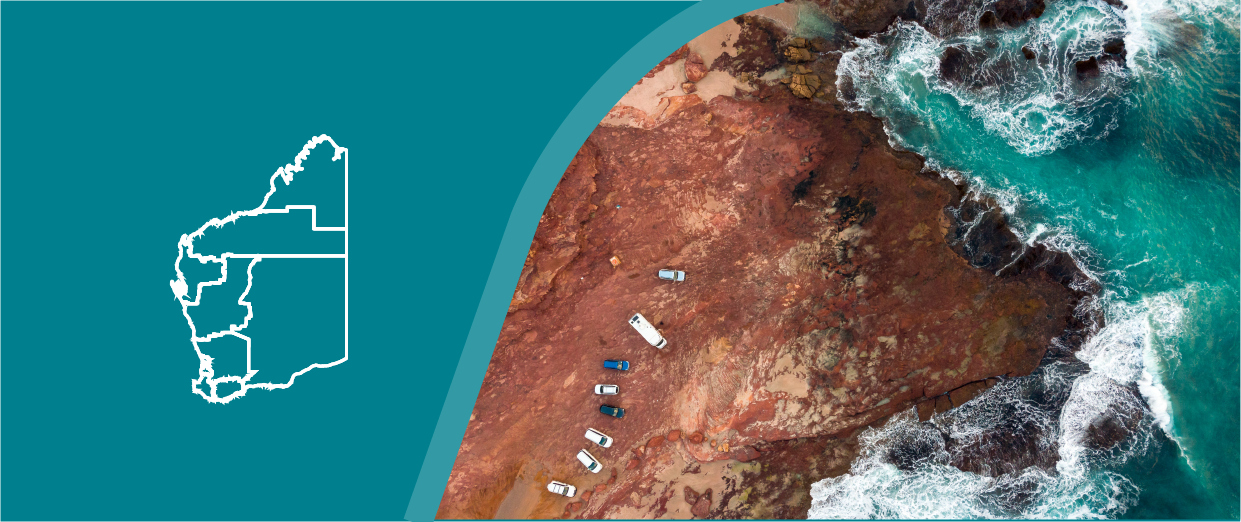
Gascoyne region

Region Image

The Gascoyne is the western-most point of Australia, with over 600 kilometres of coastline and the UNESCO World Heritage-listed Ningaloo reef, which is Australia’s largest and most accessible fringing reef. With a geographic area of over 135,000 square kilometres, the Gascoyne consists of 4 local government areas and has a key regional centre in Carnarvon.

Key statistics*

Estimated resident population: 9,262

Gross regional product: $1.6 billion

Key strengths

  • Agriculture and food, and tourism (including World Heritage areas)
  • Solar and wind resources
  • Significant Aboriginal population, culture and heritage

Infrastructure directions

  • Support agriculture and food
  • Support renewable energy and hydrogen industry
  • Support and capitalise on space science infrastructure

While the Gascoyne region is distinct, consultation highlighted that many regions face shared challenges and opportunities that need to be addressed to achieve the 2022 Strategy’s vision. As such, the majority of the 2022 Strategy’s 93 recommendations apply to the Gascoyne and other regions. It is expected that the unique circumstances of each region are taken into account when implementing recommendations.

* Adapted from Australian Bureau of Statistics, Regional population: 2019–20 financial year; Department of Jobs, Tourism, Science and Innovation, Western Australia economic profile – May 2021.

Regional development

Region Image

The long-term success of WA relies on generating strong and inclusive growth across the state’s regions. The regions must leverage their collective strengths to realise this Strategy’s vision. Considerable flow-on opportunity will come from a stronger, more collaborative approach to regional development required achieve a step change in outcomes over the next 20 years.

WA is Australia’s largest state and comprises 10 regions: Kimberley, Pilbara, Gascoyne, Mid West, Wheatbelt, Peel, South West, Great Southern, Goldfields–Esperance and Perth.


The 9 regions outside Perth are home to 25% of WA’s population, generate approximately 40% of the state’s gross state product and are an integral part of WA’s rich cultural identity. 


Many of WA’s comparative advantages are in the regions, and are well placed to realise the six strategic opportunities to build a more diverse and resilient economy.


Strategic justification

During the last resources investment boom (2007 to 2013), the WA Government focused on activating major mining, oil and gas projects and invested significantly in the liveability of regional communities. The focus for the next 20 years will need to be on diversifying and growing regional economies and communities. Investing in infrastructure that enables regions to leverage their strengths to create new business and job opportunities and attract and retain skilled workforce is a priority.


Sector challenges and opportunities

Multiple stakeholders are responsible for a range of policy areas that support regional development. A more coherent strategic framework will be required to coordinate and target action and investment to deliver long term regional outcomes.


Often the State Budget does not provide a detailed account of government investment allocated to each region. Better data on service and infrastructure investment in each region is required to provide greater transparency and make more informed investment decisions. 


Liveable and attractive regional communities require effective and sustainable social services and infrastructure. Keeping pace with their changing needs over the next 20 years will be important, as populations age, grow or decline. 


Finding more collaborative ways for government agencies to coordinate, plan and deliver social services and infrastructure has the potential to support better and more efficient service delivery across regional WA.


Case study

New South Wales is moving to a hub-and-spoke model that focuses major investment in regional centres that can support the communities that surround them. The model is defined as a ‘service delivery model that provides connections (spokes) to and from key centres (hubs). The spokes link to different hubs across an area, rather than focusing on one key hub. For further information, refer to: https://insw-sis.visualise.today/documents/INSW_2018SIS_BuildingMomentum.pdf